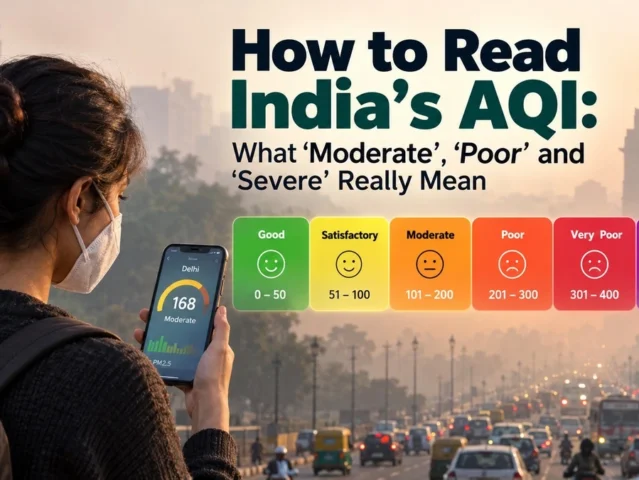



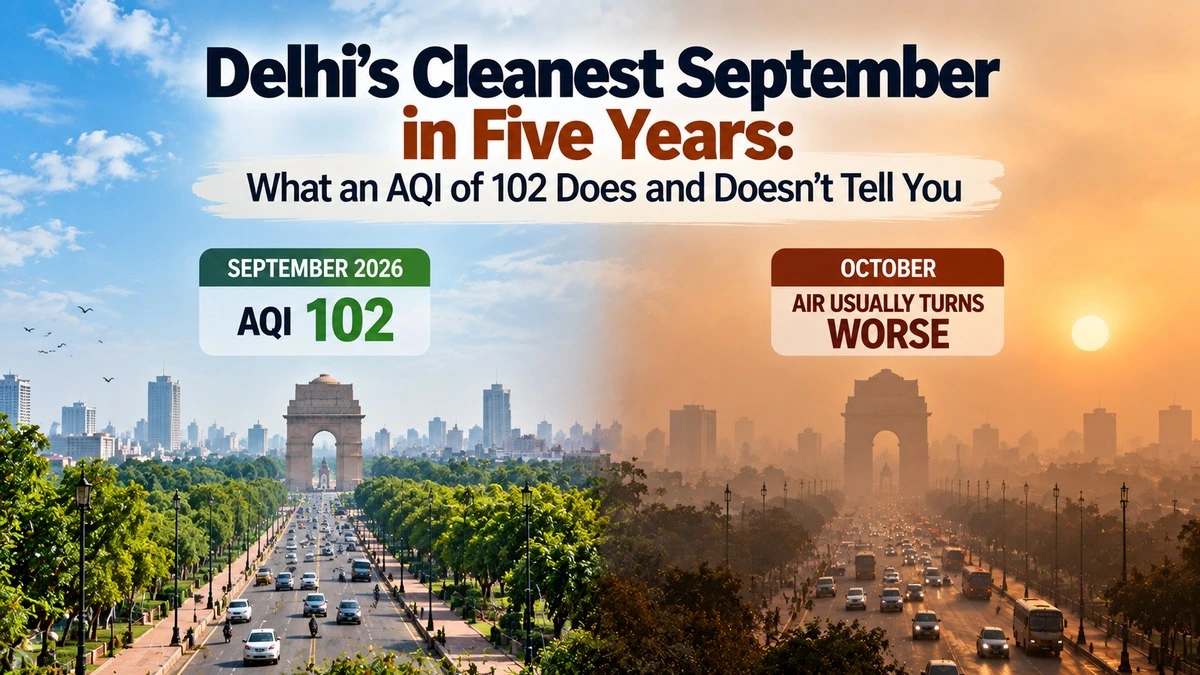
Delhi just logged its cleanest September in five years, with a monthly average AQI of 102. Then came October, the month when the city’s air usually turns. Here’s what the September number really tells you, what it hides, and why a dispute over how the year’s numbers are reported matters.
What the September numbers show
According to figures from the Commission for Air Quality Management (CAQM), Delhi’s September 2026 average AQI was 102. That’s the lowest September average in five years. For comparison, September averaged 105 in both 2025 and 2024, 108 in 2023 and 104 in 2022.
The gap is small, though. An AQI of 102 still sits in the “Moderate” band, which runs from 101 to 200 on India’s scale. It’s a better month, not a clean one. The air on September 30 itself was still a “Moderate” 129.
CAQM also reported that Delhi had 79 days rated “Poor” or worse between January and September 2026, down from 86 in 2025 and 2024, and well below 127 in 2022. Days rated “Moderate” or better reached 194, the highest in five years. Average PM2.5, the tiny particles that reach deep into lungs, was 69 µg/m³ for January 1 to September 28, the same as 2025 and lower than the 73 to 81 recorded in 2022, 2023 and 2024.
The other side of the story
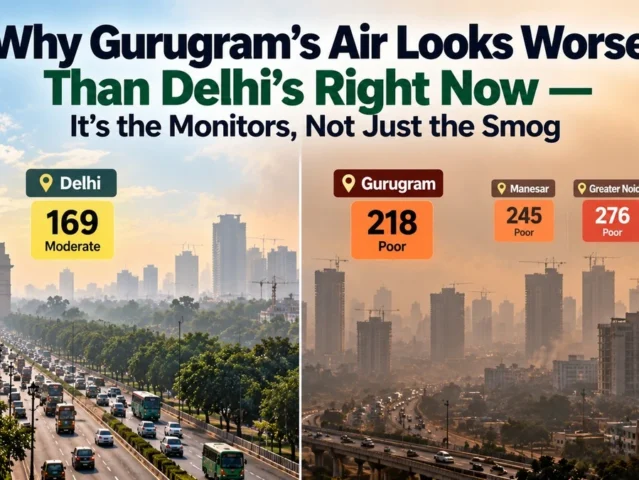
A separate analysis by the group Hawa Ka Hisab, based on CPCB’s daily 4 PM bulletins, found a different picture for the nine months overall. It put Delhi’s January–September 2026 average AQI at 167.6, up from 164.3 in the same period of 2025. July was the sharpest slide: 117.8 against 78.4 a year earlier, the worst July since 2019 by that analysis.
The same analysis looked at 39 stations with data for both years. It found AQI hit the maximum reading of 500 for 796 station-hours in 2026, compared with 256 in 2025. Those were extreme spikes, not a steady rise.
Congress leader Ajay Maken has criticised CAQM for not publishing the nine-month average in its September 30 release and for starting its comparison in 2022 rather than 2018. He has written to CAQM’s non-official members asking for the missing figures. We haven’t seen a CAQM reply.
Why both can be true
Think of two students with the same marks total. One scored steady 70s all year. The other aced most tests but crashed on a few. A “number of good days” count favours the second student. An overall average punishes the crashes. Air quality works the same way: counting how many days stayed below a line and averaging every reading answer different questions, and extreme spikes pull the average up even if most days look fine.
Different data sets also matter. CAQM’s figures and the 4 PM bulletin analysis use different slices of the data, so the two won’t match exactly.
What this means for you
- Don’t read September as a trend. Between 2021 and 2025, Delhi’s average AQI roughly doubled from about 100 in September to about 212 in October, according to reported figures.
- Watch the days, not just the average. A few severe days can matter more for health than a quiet monthly mean suggests.
- Check live readings. The CPCB’s SAMEER app shows station-level AQI. Use it before planning outdoor exercise.
- Prepare early. Check your purifier filters and keep a well-fitting N95 mask at hand before the smog season peaks.
Data-viz idea
A simple line chart of Delhi’s monthly average AQI from January to October for 2025 and 2026 would show July’s gap and the September dip at a glance. A second bar chart could compare “Poor-or-worse” days by year from 2022 to 2026.
The bottom line
September was Delhi’s best in five years, and the credit is real but modest. The bigger test starts now, as crop-residue fires and cooler, stiller air arrive. Fair, complete reporting of the whole year’s numbers will help residents judge whether the improvement lasts.
Related reading: how to read India’s AQI categories, Punjab’s farm-fire season and its effect on Delhi, and PM2.5 versus PM10.
Sources
- Organiser: Delhi’s September AQI hits five-year low (citing CAQM data)
- UNI: Delhi air quality worsened in 2026, report says; Congress flags CAQM data omission
- NewsBytes: Delhi’s September 2026 average AQI at 102
- CPCB National Air Quality Index portal
By Dr. Ananya Sharma, Ph.D. Environmental Science | Air Pollution & Urban Air Quality. This article was researched and fact-checked against the cited sources and reviewed by our editorial team. Last updated: October 9, 2026.