





By Dmitri Volkov, B.Sc. Environmental Science (Air Quality & Environmental Monitoring) · Last updated: October 10, 2026
The AQI number on your phone feels like a simple reading, like a thermometer. It isn’t. It’s the end of a long chain that starts with a metal box on a rooftop somewhere. Knowing how that box works explains why numbers differ by neighbourhood, why readings sometimes vanish, and how much to trust them.
What a monitoring station actually does
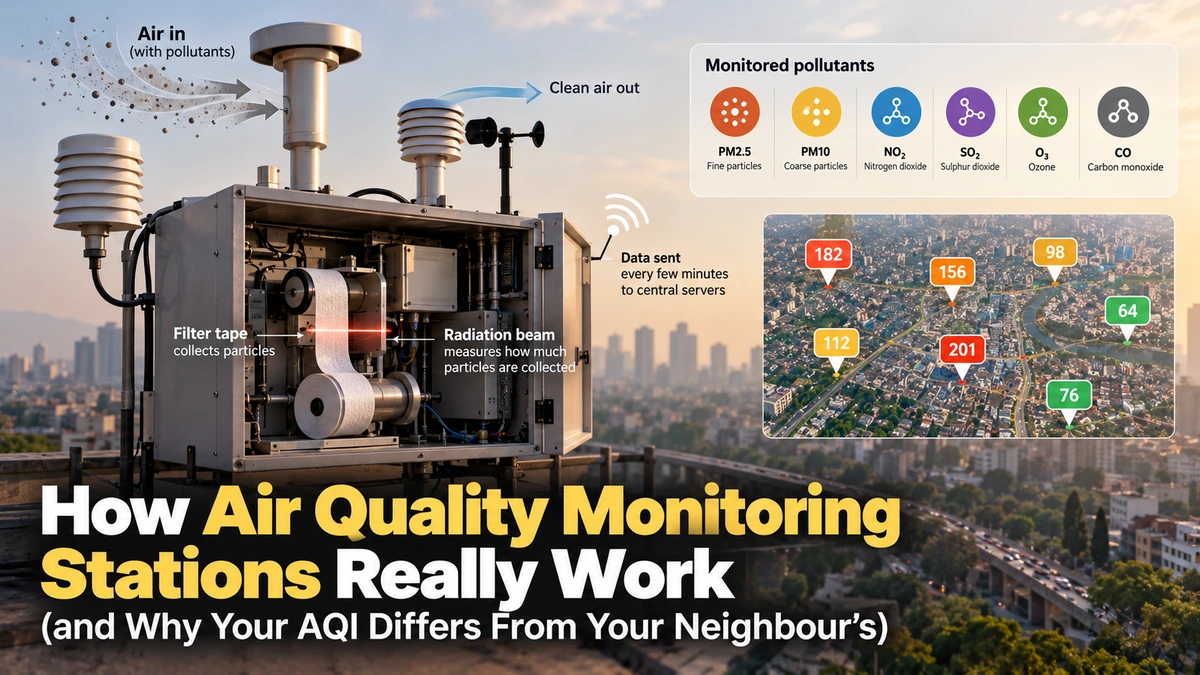
India’s official network is made up of Continuous Ambient Air Quality Monitoring Stations, known as CAAQMS, run by the Central Pollution Control Board (CPCB) and state agencies. Each station pulls in outside air through an inlet, measures it automatically, and sends results to a central dashboard every few minutes.
Most stations track fine particles (PM2.5 and PM10) plus gases such as nitrogen dioxide, sulphur dioxide, ozone and carbon monoxide. The AQI you see is built from those readings, with the worst pollutant setting the headline number.
How a station weighs dust
Many official PM monitors work like a very careful weighing scale. Air flows through a strip of filter tape, and a weak beam of radiation passes through it. The more particles collected, the more the beam is blocked. From that, the instrument works out how much dust was in the air.
This method is trusted because it measures particle weight directly. It still needs care, though. Moisture on the tape can distort the result, so these monitors include a heater to dry the air first. Even then, very humid days can be tricky.
Where low-cost sensors fit in
Small, cheap sensors, the kind in home air monitors and many apps, work differently. They shine a light through the air and measure how much scatters off particles. It’s quick and affordable, but it’s an estimate of weight, not a direct weighing.
Humidity is the big weakness. Water in the air makes particles swell, scatter more light, and read higher than they really are. Studies comparing sensors with official monitors, including one in Delhi, found they can track pollution trends well, and can come within roughly 10% of official values once corrected for humidity. Uncorrected, they often overshoot.
Why two readings in one city can differ
- Location. A station beside a busy road reads higher than one in a park a few kilometres away. Delhi alone has around 46 official stations, and their readings can differ a lot on the same day.
- Height and surroundings. Rooftops, trees and nearby walls change what the inlet catches.
- Method. Official monitors and low-cost sensors measure the same air in different ways.
- Averaging. A live reading and a 24-hour average are different numbers, and apps don’t always say which one they show.
- Gaps. Stations go offline for maintenance, power cuts or faults. Government figures reported as of May 2025 listed roughly 560 CAAQMS nationwide, with about 470 working at that time, so a missing reading isn’t unusual.
What this means for you
- Check the station closest to you, not just the city average.
- If an app and the CPCB disagree, look at whether the app is using official data or its own sensors.
- If a number looks stuck or oddly low, the station may be down. Compare it with a neighbouring one.
- Judge air by the trend over several hours rather than one reading.
- If you buy a home sensor, treat it as a guide to rising or falling pollution, not a precise measurement.
Visuals worth building
A simple diagram of air flowing into a station, through the filter and out as a number would make the process click. A map of a city’s stations coloured by their readings at one time of day would show how much air quality varies from street to street.
The bottom line
Official stations are the benchmark, and low-cost sensors fill gaps. Neither is perfect, and knowing their limits makes you a smarter reader of the number on your screen.
Related reading: Why two AQI apps show different numbers; how to read India’s AQI categories; PM2.5 vs PM10.
Sources
- Central Pollution Control Board – Central Control Room for Air Quality Management
- CPCB – National Ambient Air Quality Monitoring information
- All India Radio – CAQM to install new air quality monitoring stations in Delhi-NCR (February 2026)
- U.S. EPA – Air Sensor Toolbox
This article was researched and fact-checked against official and primary sources, then reviewed by our editorial team. We update posts when new data is published.