


Last updated September 15, 2026.
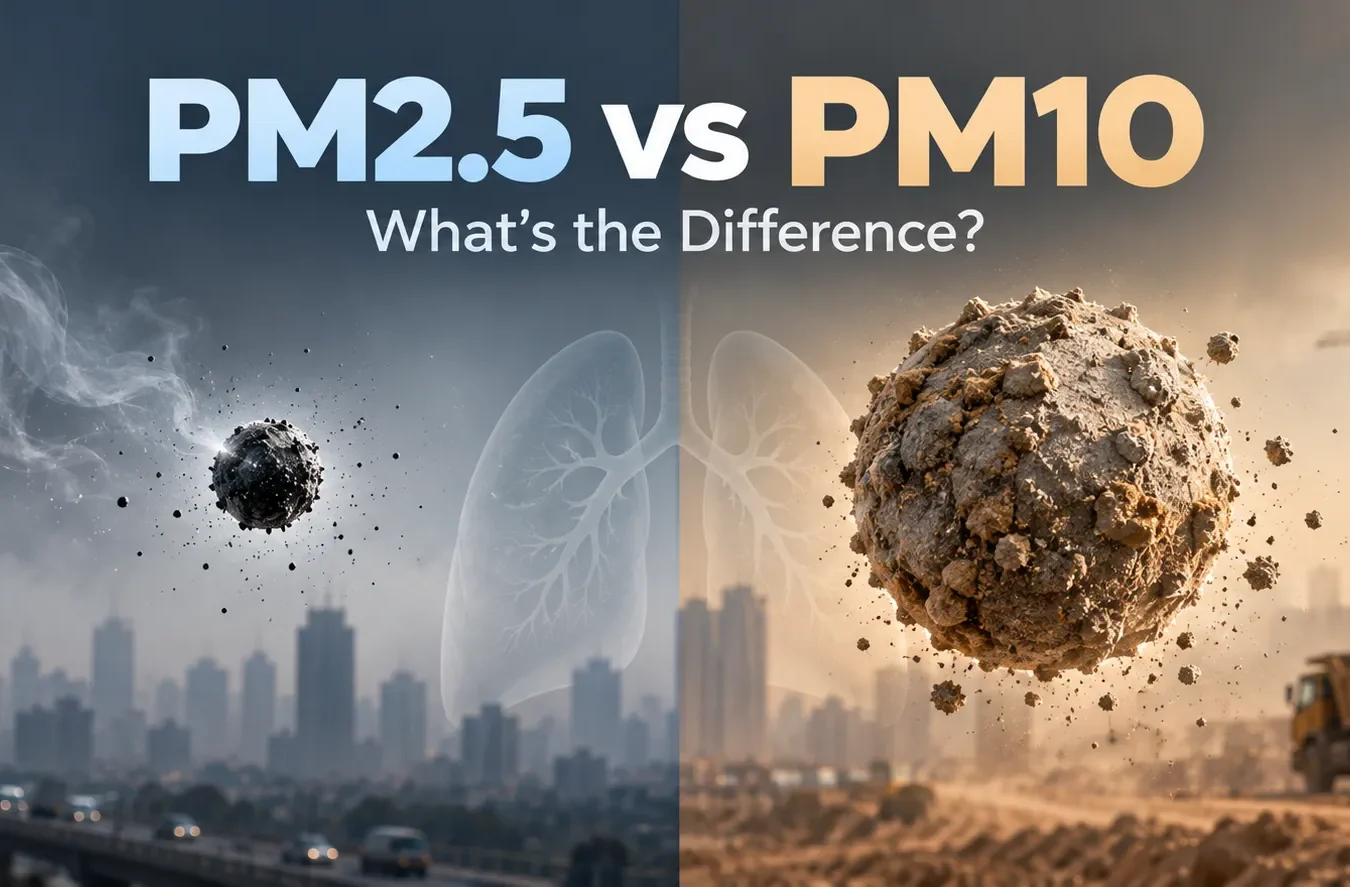
Open almost any air-quality app and you’ll see two particulate readings side by side: PM2.5 and PM10. Most people glance past the second one, or assume they’re roughly interchangeable. They’re not. They measure different-sized particles, from different sources, that behave differently once you breathe them in — and knowing which one is driving a bad reading changes what you should actually do about it.
Two sizes, one invisible problem
“PM” stands for particulate matter — solid and liquid particles suspended in the air, too small to see individually. The number after it is the maximum width of the particles being counted, in micrometers. PM10 covers particles up to 10 micrometers across; PM2.5 covers particles up to 2.5 micrometers, less than a third the size.
For scale: a single human hair is roughly 70 micrometers thick. A PM10 particle is about a seventh of that width. A PM2.5 particle is small enough that more than two dozen could line up across the width of one hair strand. Both are far too small to see or feel individually — you only notice their combined effect, as haze or a scratchy throat.
Different sizes, different sources
PM10 is dominated by mechanically generated dust: road and construction dust, crushed rock, pollen, sea spray, and windblown soil. PM2.5 comes mostly from combustion — vehicle exhaust, wildfire and crop-burning smoke, industrial and power-plant emissions — plus particles that form afterward in the atmosphere from pollutant gases reacting with sunlight and moisture. That’s why a dusty, windy day and a smoky, still day can produce very different PM2.5-to-PM10 ratios even at a similar overall AQI.
Why size changes what happens in your body
The body’s natural filters — nose hair, mucus, the upper airway — catch most PM10-sized particles before they get far. PM2.5 is small enough to slip past those defenses, reach deep into the lungs’ smallest airways, and in some cases cross into the bloodstream, which is a major reason global health guidance treats it as the more dangerous of the two.
How the official limits compare
StandardPM2.5 annualPM2.5 24-hourPM10 annualPM10 24-hour
WHO guideline (2021)5 µg/m³15 µg/m³15 µg/m³45 µg/m³
US EPA NAAQS (2024)9.0 µg/m³35 µg/m³no annual standard150 µg/m³
India CPCB (2009)40 µg/m³60 µg/m³60 µg/m³100 µg/m³
WHO’s numbers are health-based recommendations, not enforceable law anywhere; the EPA and CPCB rows are each country’s actual legal limit. Notice the gap between WHO’s guideline and either country’s legal standard — that gap is real, and it’s one reason “within the legal limit” and “meets WHO’s health guidance” aren’t the same claim.
What this means for you
- When PM2.5 is high but PM10 is closer to normal, you’re likely looking at smoke or vehicle/industrial pollution — the more penetrating, higher-health-risk type. Take it seriously even if the overall AQI looks moderate.
- When PM10 spikes but PM2.5 stays lower, it’s probably dust — construction, a dust storm, or dry windy conditions. Still irritating for eyes, throat, and asthma, but generally less deep-lung risk than a PM2.5 spike of the same size.
- On any high-PM2.5 day, a well-fitted N95 or KN95 mask helps; a basic surgical or cloth mask does much less for particles this small.
- If your app only shows one combined AQI number, tap into it for the PM2.5/PM10 breakdown before deciding how cautious to be — the mix matters as much as the headline number.
Data to watch
A to-scale illustration comparing a human hair’s cross-section to PM10 and PM2.5 particle sizes would make the “you can’t see this” point visually concrete.
A grouped bar chart of the WHO, US EPA, and India CPCB limits side by side for both PM2.5 and PM10 would echo the comparison table above.
The headline AQI number tells you how bad the air is. The PM2.5/PM10 split tells you what kind of bad — and that’s often the more useful thing to know.
Related reading
- Why AQI numbers differ by country
- India’s 2026 monsoon withdrawal and the post-monsoon pollution season
- Southeast Asia’s 2026 haze crisis
Sources
- World Health Organization, via IQAir. (2021). New WHO air quality guidelines will save lives.
- U.S. EPA, via Federal Register. (2024, March 6). Reconsideration of the National Ambient Air Quality Standards for Particulate Matter.
- Central Pollution Control Board (India). (2009, November 18). National Ambient Air Quality Standards.
This post was researched and fact-checked against the official sources listed above, using current regulatory standards. It’s reviewed by our editorial team before publishing, and we’ll update it if any of these standards change.


