


By Dr. Lukas Müller, Ph.D. Atmospheric Sciences (Atmospheric Chemistry & Air Pollution) · Last updated: 27 September 2026
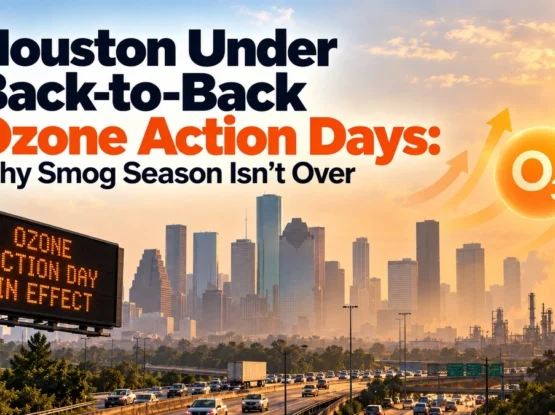
Clear blue sky, bright sun, no haze in sight, and your air quality app still shows an elevated reading. The pollutant behind it is often ground-level ozone. You can’t see it, it isn’t released from any exhaust pipe, and it tends to peak on exactly the days that look cleanest. Here’s what’s going on.
Good ozone, bad ozone
Ozone is the same gas in two very different places. High in the stratosphere, roughly 15 to 30 km up, the ozone layer shields us from ultraviolet radiation. That’s the “good” ozone. Down at street level, where we breathe it, ozone is an irritant that damages lung tissue. Both are the same molecule. Only the location differs.
Where ground-level ozone comes from
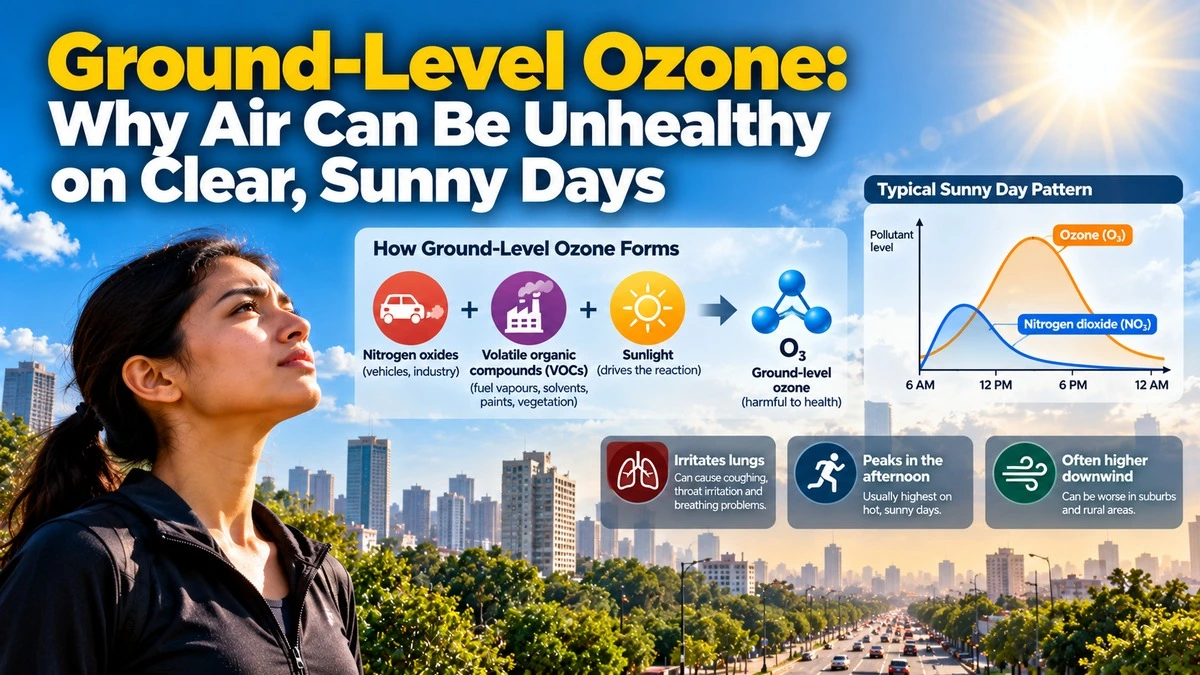
Unlike soot or dust, ozone near the ground is almost never emitted directly. It’s a secondary pollutant, cooked up in the air from other ingredients:
- Nitrogen oxides from vehicle engines, power plants and industrial burning.
- Volatile organic compounds from fuel vapours, solvents, paints and some vegetation.
- Sunlight, which drives the reaction.
An oven is a useful comparison. Traffic and industry supply the raw ingredients during the morning. Sunlight is the heat. By early to mid-afternoon the “baking” is done and ozone levels reach their daily peak. After sunset the reaction slows, and in cities some of the ozone is broken down again overnight.
A simple chart makes this easy to see: plot hourly ozone and nitrogen dioxide over a sunny day. Nitrogen dioxide peaks during the morning rush hour, and ozone rises a few hours later, with its highest point in the afternoon.
Why it’s often worse outside the city centre
Counterintuitively, ozone readings are frequently higher in suburbs and countryside downwind of a city than in the busy centre itself. The ingredients take time to react while the wind carries them away. And in the centre, fresh exhaust actually “uses up” some ozone. That’s also why ozone is a regional problem that crosses city and even national borders. A hot, still, sunny spell can raise levels across hundreds of kilometres at once.
How much is too much?
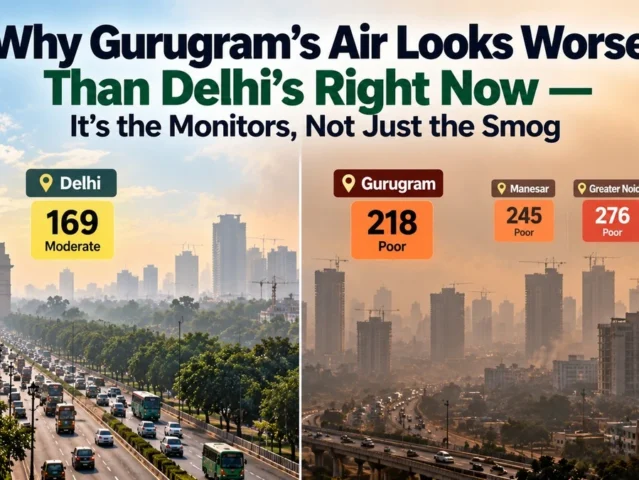
Ozone is usually measured as an average over eight hours. The World Health Organization’s 2021 air quality guidelines recommend keeping that eight-hour average below 100 micrograms per cubic metre. India’s national ambient air quality standard uses the same 100 µg/m³ eight-hour limit. In India’s AQI, ozone is one of the pollutants counted, so on some summer and pre-monsoon afternoons it’s ozone, not particulate matter, that sets the day’s AQI.
What this means for you
- Check which pollutant is driving the AQI. Most apps and the CPCB portal list the “prominent pollutant”. If it says O3, the advice below applies.
- Shift outdoor exercise to the morning. On high-ozone days, early morning is usually the cleanest window. Late afternoon is the worst.
- Take symptoms seriously. Coughing, throat irritation, chest tightness or shortness of breath during exertion are typical ozone effects, and people with asthma are especially sensitive.
- Don’t rely on masks. Standard particle masks like N95s filter particles, not gases like ozone. Reducing exertion and exposure time works better.
- Indoors usually helps. Ozone levels indoors are typically lower than outdoors, particularly with windows closed during the afternoon peak.
The bottom line
Ground-level ozone is the pollutant of sunny, still weather. It forms in the air rather than coming out of a tailpipe, it peaks in the afternoon, and it often travels well beyond the city that produced its ingredients. A clear sky doesn’t always mean clean air. Checking the prominent pollutant and timing your outdoor activity are the two simplest ways to protect yourself.
Related reading: PM2.5 vs PM10 explained; how temperature inversions trap pollution; how to read India’s AQI categories.
Sources
- US EPA: Ground-level ozone basics
- US EPA: Health effects of ozone pollution
- WHO global air quality guidelines (2021)
- CPCB: National Ambient Air Quality Standards
- CPCB: National Air Quality Index
This article was researched and fact-checked against WHO, US EPA and CPCB guidance, and reviewed by our editorial team.