Most air quality apps show you one AQI number, but that number is usually built from two separate pollutants: PM2.5 and PM10. They sound like a size chart, and that’s basically what they are — but the size difference is exactly why one matters more for your health than the other.
What the Numbers Mean
Both PM2.5 and PM10 describe particulate matter: tiny solid particles and liquid droplets suspended in the air, made up of things like dust, soot, smoke, and chemical compounds such as sulphates and nitrates. The number refers to particle size in micrometres.
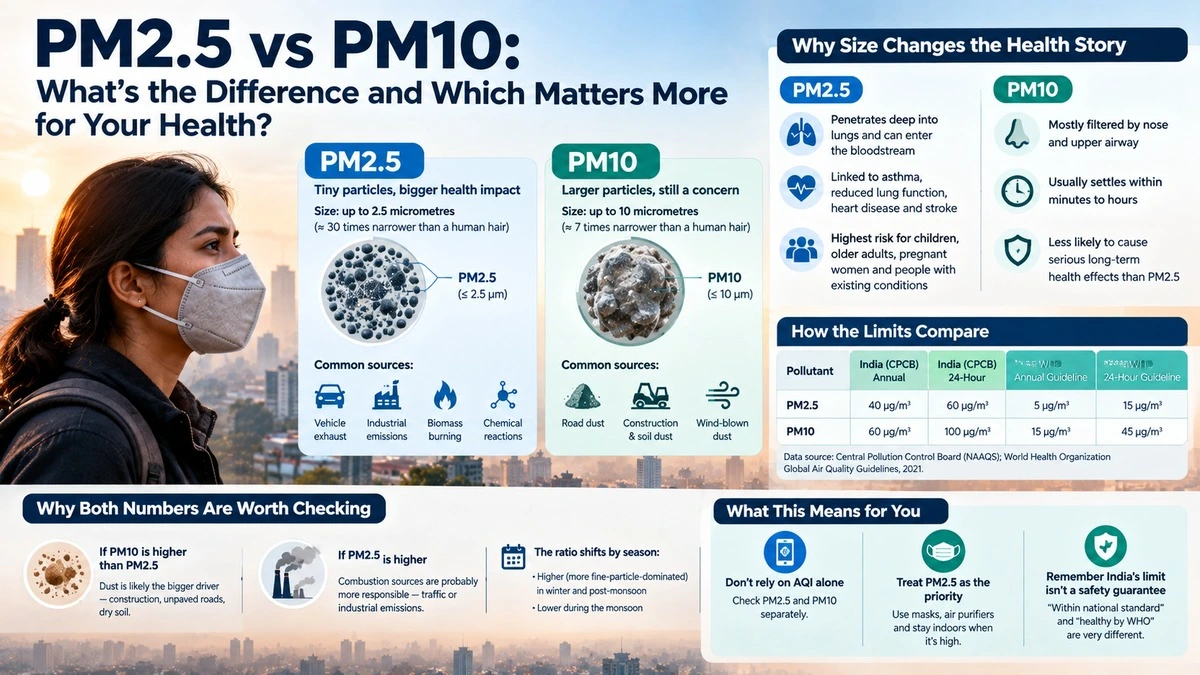
PM10 covers particles up to 10 micrometres across — about 7 times narrower than a human hair. PM2.5 covers particles up to 2.5 micrometres — nearly 30 times narrower than a hair, and small enough that PM2.5 is technically a subset of PM10. The coarser fraction between 2.5 and 10 micrometres is usually dust: construction sites, road dust kicked up by traffic, wind-blown soil. PM2.5 tends to come from combustion — vehicle exhaust, industrial burning, biomass fires — or forms in the atmosphere when gases like sulphur dioxide and nitrogen oxides react chemically.
Why Size Changes the Health Story
Your body is reasonably good at stopping bigger particles. PM10’s larger particles mostly get filtered by your nose and upper airway, or settle out of the air within minutes to hours. PM2.5 doesn’t get filtered the same way — it’s small enough to travel deep into your lungs, and some of it is small enough to cross into your bloodstream. That’s why PM2.5 is linked more strongly to serious long-term effects: aggravated asthma, reduced lung function, higher cardiovascular risk including heart disease and stroke, and with prolonged exposure, conditions like COPD. Children, older adults, pregnant women, and people with existing heart or lung conditions carry the highest risk from both, but especially PM2.5.
How the Limits Compare
India’s regulatory limits, set by the Central Pollution Control Board’s National Ambient Air Quality Standards (NAAQS), are considerably looser than the World Health Organization’s health-based guidelines:
PollutantIndia (CPCB) AnnualIndia (CPCB) 24-HourWHO Annual GuidelineWHO 24-Hour Guideline
PM2.540 µg/m³60 µg/m³5 µg/m³15 µg/m³
PM1060 µg/m³100 µg/m³15 µg/m³45 µg/m³
Data source: Central Pollution Control Board (NAAQS); World Health Organization Global Air Quality Guidelines, 2021.
India’s annual PM2.5 limit is 8 times looser than WHO’s guideline; the PM10 limit is 4 times looser. That gap isn’t a measurement error — CPCB’s standards are a regulatory compliance threshold, while WHO’s numbers are a health-based target with no legal force in India. A city can be well within Indian limits and still be far above what WHO considers safe.
Why Both Numbers Are Worth Checking
Looking at PM2.5 and PM10 together tells you more than either alone. If PM10 is climbing faster than PM2.5, dust is likely the bigger driver — construction, unpaved roads, dry soil. If PM2.5 is the larger share of the total, combustion sources like traffic or industrial emissions are probably more responsible. A 2025 study across 70 monitoring stations in Delhi and Haryana found this ratio shifts by season, skewing higher (more fine-particle-dominated) in winter and the post-monsoon period, and lower during the monsoon.
What This Means for You
- Don’t rely on AQI alone: check the PM2.5 and PM10 sub-readings separately when your app shows them — they tell you what kind of pollution you’re dealing with, not just how much.
- Treat PM2.5 as the higher-priority number for health decisions: masks, air purifiers, and staying indoors matter most when PM2.5 is elevated, since it’s the fraction that reaches deep into your lungs and bloodstream.
- Remember India’s limit isn’t a safety guarantee: “within national standard” and “healthy by WHO’s benchmark” are very different claims, especially for PM2.5.
Written by Anna Schneider, M.Sc. Environmental Engineering, whose work focuses on particulate matter science and urban pollution patterns. This article was researched and fact-checked against the cited sources below and reviewed by the AQI World editorial team.