



By Dr. Lukas Müller, Ph.D. Atmospheric Sciences (Atmospheric Chemistry & Air Pollution). Researched and fact-checked against the sources listed below and reviewed by our editorial team. Last updated: October 12, 2026.
Most people know PM2.5. Far fewer know nitrogen dioxide, or NO2, even though it comes straight out of the tailpipes and chimneys around them. It’s one of the main gases that air-quality agencies track, and it’s a good clue to how much traffic and combustion is shaping the air you breathe.
What nitrogen dioxide is
NO2 is a reddish-brown gas with a sharp smell. It forms whenever fuel burns at high temperature, because the heat makes nitrogen and oxygen in ordinary air combine. Think of it as a by-product of combustion rather than something burned fuel contains.
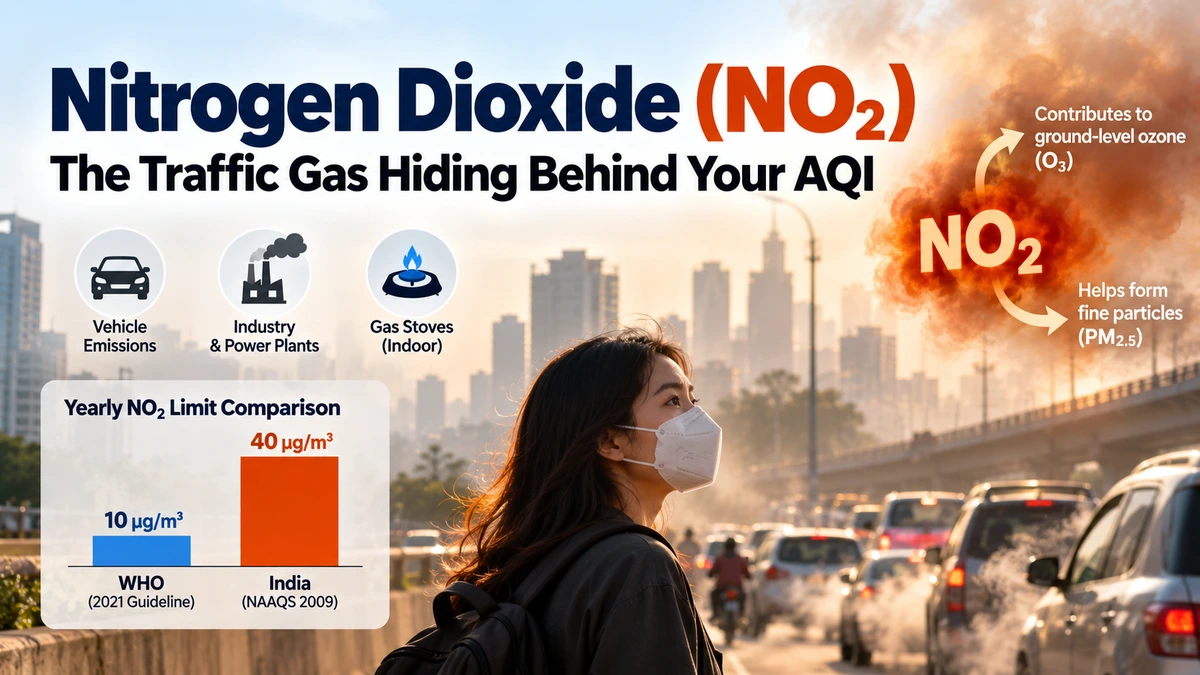
The main sources are:
- Vehicles, especially diesel engines and heavy traffic
- Power plants and industry that burn coal, oil or gas
- Gas stoves and heaters indoors, where ventilation is poor
Why it matters beyond the gas itself
NO2 does two jobs in the air. First, it irritates the airways directly. The US Environmental Protection Agency links short-term exposure to inflamed airways and more asthma symptoms, particularly in children and people with existing lung conditions. Second, it’s a building block. In sunlight it helps create ground-level ozone, and it also helps form fine particles that add to PM2.5. So cutting NO2 helps cut two other pollutants.
How safe limits compare
The World Health Organization tightened its guideline in 2021. India’s national standards, set in 2009, are more relaxed:
StandardYearly average24-hour level
WHO 2021 guideline10 µg/m³25 µg/m³
India NAAQS (2009)40 µg/m³ (30 in sensitive areas)80 µg/m³
That makes India’s yearly limit four times WHO’s guideline. A city can pass the national test and still sit well above the level WHO considers protective. Note that the figures are micrograms per cubic metre of air, the unit most monitoring dashboards use.
Why NO2 is a street-level problem
Unlike fine particles, which can drift for hundreds of kilometres, NO2 is concentrated near its source. Levels are usually highest next to busy roads and fall off within a short distance. That’s why two neighbourhoods in the same city can have quite different readings, and why a station beside a junction reads higher than one in a park. From space, satellites such as Europe’s Sentinel-5P can map NO2 over whole cities, and the traffic pattern shows up clearly.
What this means for you
- Walk and cycle on side streets where you can, a block or two away from main roads.
- Ventilate when cooking with gas. Use the extractor fan or open a window.
- Time your outdoor exercise away from rush hour.
- Check which pollutant drives your AQI. Many apps list it, and NO2 days call for a different response than dust days.
Chart ideas
A bar chart placing WHO’s and India’s yearly NO2 limits side by side makes the gap obvious. A second, simple diagram could show NO2 falling as you move away from a busy road.
The bottom line
NO2 is an invisible traffic-and-combustion marker with real effects on lungs, and it feeds ozone and fine particles too. Knowing it exists is the first step to reading your local air more accurately.
Related reading
- Ground-level ozone: why air can be unhealthy on sunny days
- PM2.5 vs PM10: what’s the difference?
- Why AQI apps show different numbers for the same city


