



By Anna Schneider, M.Sc. Environmental Engineering | Particulate Matter & Urban Pollution. Last updated: 23 September 2026.
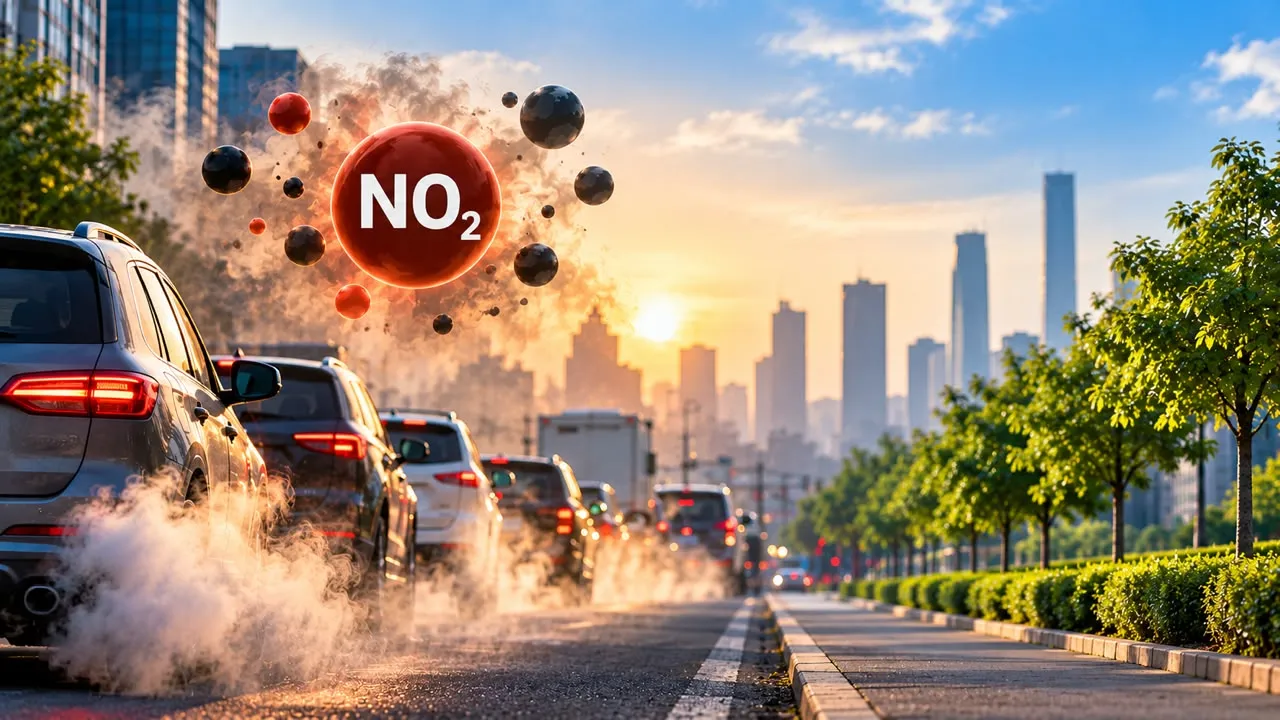
Open any air quality app and you’ll see a list of pollutants under the headline number. PM2.5 gets most of the attention, but nitrogen dioxide (NO2) is the one that follows traffic most closely. It’s also the pollutant most likely to be high on your street while the city-wide AQI looks fine.
What NO2 is and where it comes from
NO2 is a reddish-brown gas that forms whenever fuel burns at high temperature. The main sources are:
- Road traffic, especially diesel vehicles
- Power plants and industrial boilers
- Gas stoves and heaters indoors
Because so much of it comes from exhaust pipes at street level, NO2 is very local. Levels beside a busy road can be several times higher than in a park a few blocks away, and they typically fall off within a few hundred metres of the traffic.
Why it matters for your health
NO2 irritates the lining of the airways. Short bursts can trigger coughing and asthma attacks. Long-term exposure is linked to children developing asthma in the first place, according to the US Environmental Protection Agency. NO2 also reacts in sunlight to help form ground-level ozone and fine particles, so it feeds the other pollutants on your app too.
The European Environment Agency estimates that bringing NO2 down to World Health Organization guideline levels could have prevented about 34,000 deaths in the EU in 2023.
How the safe limits compare
StandardYearly average (µg/m³)24-hour average (µg/m³)
WHO guideline (2021)1025
India national standard (CPCB)4080
EU limit today40–
EU limit from 20302050
The gap is striking. India’s yearly limit and the EU’s current one are four times the WHO guideline. Europe’s revised rules halve its limit by 2030, but even that stays above what the WHO recommends.
Why NO2 often hides behind your AQI
Most AQI systems report the single worst pollutant as the headline number. In many cities that’s PM2.5, so a “moderate” reading can mask high NO2 near main roads. Tap into the pollutant breakdown on your app to see the NO2 sub-index separately.
Satellites show the traffic link clearly. The European Space Agency’s Sentinel-5P satellite maps NO2 daily, and its images from spring 2020 showed sharp drops over major cities as lockdowns emptied roads. A side-by-side map of a city before and during lockdown is one of the clearest ways to picture where NO2 comes from.
What this means for you
- Pick quieter routes. Walking, cycling or running one street back from a main road can noticeably cut your exposure.
- Time your windows. If your home faces a busy road, keep road-side windows closed during rush hours and air rooms out later.
- Ventilate while cooking on gas. Use an extractor hood that vents outside, or open a window.
- Know your purifier’s limits. HEPA filters trap particles, not gases. Only purifiers with a substantial activated-carbon filter reduce NO2.
- In traffic jams, set your car’s ventilation to recirculate.
NO2 is the pollutant you can most directly avoid, because it stays close to its source. Knowing where it concentrates lets you make small daily choices that add up.
Related reading: ground-level ozone vs. PM2.5, and PM2.5 vs. PM10 explained.
Sources
- WHO Global Air Quality Guidelines (2021)
- EEA: Harm to human health from air pollution in Europe, 2025
- EU Ambient Air Quality Directive (EU) 2024/2881
- CPCB: National Ambient Air Quality Standards
- US EPA: Basic information about NO2
- ESA: Sentinel-5P
This article was researched and fact-checked against WHO, EEA, EU, CPCB and US EPA sources and reviewed by our editorial team.


