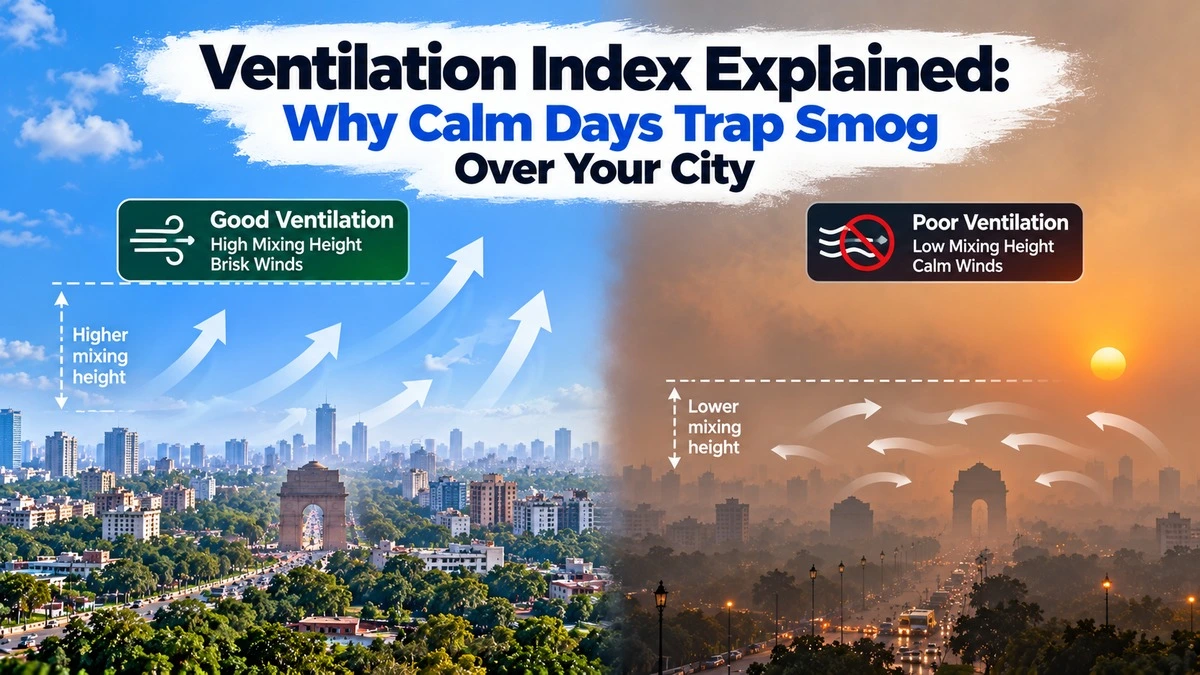
Two days can have identical traffic, factories and farm fires, and still produce very different AQI readings. The difference is often the weather’s ability to carry pollution away. Forecasters measure that ability with something called the ventilation index.
By Dr. Lukas Müller, Ph.D. Atmospheric Sciences (Atmospheric Chemistry & Air Pollution). Last updated: 5 October 2026. This article was researched and fact-checked against the sources listed below and reviewed by our editorial team.
The room analogy
Picture a smoky kitchen. Two things decide how quickly the smoke clears: how tall the room is, and how hard the air moves through it. A high ceiling gives smoke more space to spread into. A strong draught pushes it out of the window.
The atmosphere works the same way. The ‘ceiling’ is the mixing height, the depth of the lowest layer of air where pollution can spread upward. The ‘draught’ is the wind speed in that layer. The ventilation index combines the two into a single score for how well the air can flush itself out.
Reading the score
A bigger number means better flushing. Delhi’s Early Warning System, for example, treats a ventilation index below 6,000 square metres per second, paired with winds under 10 km/h, as unfavourable for dispersing pollutants. That was the situation flagged in the first days of October 2026, when Delhi’s AQI climbed to 166 on October 1 and 187 by October 4.
ConditionMixing heightWindEffect on air
Good ventilationHighBriskPollution spreads out and leaves
Poor ventilationLowCalmPollution pools near the ground
Why autumn and winter are worse
In cooler months the ground loses heat quickly after sunset. The air near the surface chills and the mixing height shrinks, sometimes to a few hundred metres at night. Add a temperature inversion, where a layer of warmer air sits above colder air like a lid on a pot, and pollution has nowhere to go. Mornings are usually the worst, and afternoons, when the sun lifts the mixing height, are usually the best.
What this means for you
- Time your outdoor activity. Afternoons usually have better ventilation than early mornings or late evenings.
- Don’t read a rising AQI as proof that emissions jumped. Sometimes the weather simply stopped cleaning the air.
- Look at the forecast wind. Several days of light wind often precede a pollution build-up.
- Close windows during the stagnant hours and ventilate your home when the afternoon air is cleanest.
A chart worth building
A daily line chart showing wind speed and AQI for the same city over a month would make the link visible: AQI usually rises as wind falls. A second chart showing hourly AQI on a typical autumn day would show the morning peak and afternoon dip.
The takeaway
Pollution levels come from two things: how much is released and how well the air carries it away. The ventilation index captures the second half, and it’s often the reason a city’s air changes overnight.
Related reading
- Temperature inversions and winter smog
- Why AQI is worse in the morning
- How to read India’s AQI categories