You check one app and it says your city’s AQI is 100. Another says 155. A third says the air is “good.” Before you decide someone’s wrong, know this: the numbers can all be honest and still disagree. Here are the four main reasons, and how to pick the one that suits you.
1. They use different scales
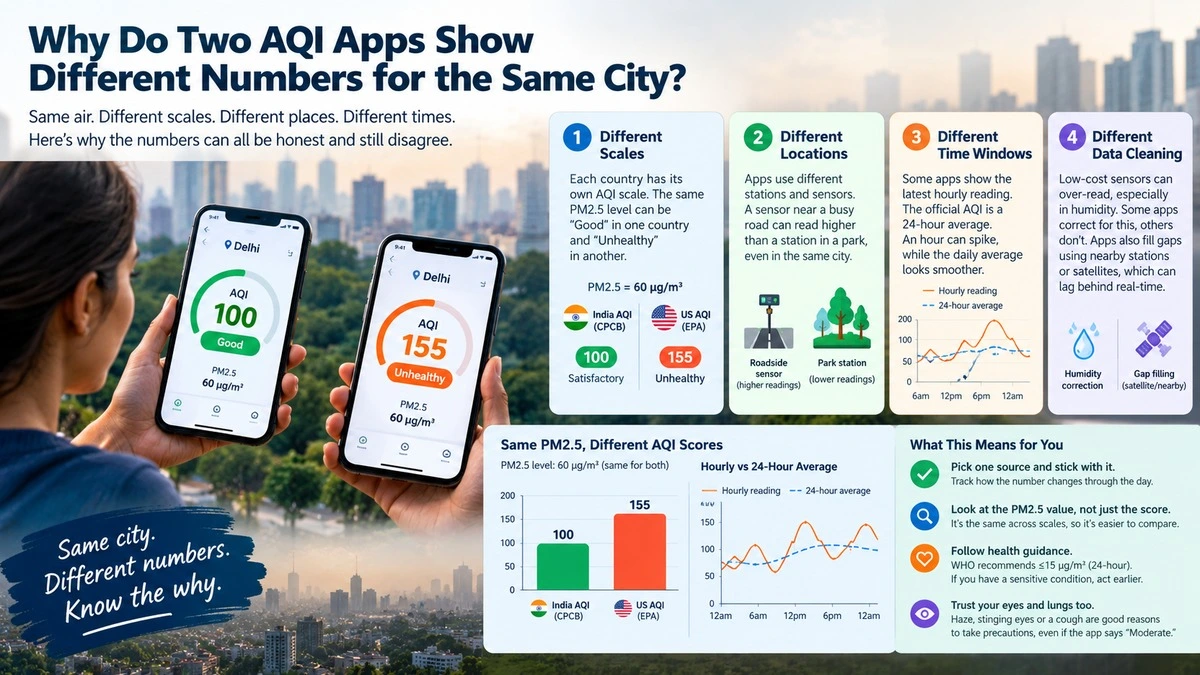
AQI isn’t a physical measurement like temperature. It’s a score, and each country builds its own scoring ladder. India’s national AQI, run by the Central Pollution Control Board (CPCB), treats a PM2.5 level of 60 micrograms per cubic metre as the top of the “Satisfactory” band, a score of 100. The US scale, used by many global apps, is stricter at the low end. The same 60 micrograms lands well into the US “Unhealthy” range, with a score in the 150s.
Same air, same dust, different ruler. It’s like measuring a room in feet on one app and metres on another, except the ruler also has different stretch points.
2. They measure in different places
Official stations are carefully sited and use expensive, calibrated instruments. Many apps also pull in low-cost sensors that people install on balconies, rooftops or beside roads. A sensor next to a busy junction will read higher than a station in a park a few kilometres away. A city isn’t one number; it’s a patchwork.
3. They average over different time windows
Some apps show the latest hourly reading. The CPCB’s headline AQI is built from a 24-hour average. An hourly figure can jump after a bonfire, a traffic jam or a gust of dust, while the daily average smooths it out. If you check at 8 pm and a friend checks at 8 am, you may both be right.
4. They clean and adjust data differently
Low-cost sensors are sensitive to humidity, and humid air can make them over-read. Good providers correct for this. Others don’t. Some apps also fill gaps by estimating from nearby stations or satellites, which can lag behind what’s actually happening on your street.
What this means for you
- Pick one source and stick with it. Watching how a single number changes through the day tells you more than comparing apps.
- Look at the PM2.5 value, not just the score. The raw micrograms figure is the same across scales, so it’s the easiest way to compare.
- Judge by the health guidance. The World Health Organization recommends a 24-hour PM2.5 level of no more than 15 micrograms per cubic metre, much lower than India’s “Satisfactory” ceiling. If you have a sensitive condition, act earlier than the colour band suggests.
- Trust your eyes and lungs too. Stinging eyes, a haze on the horizon or a cough are good reasons to take precautions even when an app says “Moderate.”
Ideas for a quick visual
A side-by-side bar chart would make the point instantly: the same PM2.5 reading (say 60 micrograms) shown as an India AQI score next to a US AQI score. A second chart could plot hourly readings against the 24-hour average for one day to show how much the hourly line swings.
The bottom line
Different AQI numbers usually mean different scales, locations and timing, not bad data. Choose a trusted source, track the PM2.5 figure, and let health guidance, not the colour, set your caution level.
Related reading
- How to read India’s AQI categories
- PM2.5 vs PM10: what’s the difference?
- Do air purifiers actually work?
Sources
- CPCB National Air Quality Index portal
- US EPA AirNow: AQI basics
- WHO global air quality guidelines (2021)
By Dmitri Volkov, B.Sc. Environmental Science, air quality and environmental monitoring. This article was researched and fact-checked against primary sources and reviewed by our editorial team. Last updated: October 7, 2026.